AI-Driven Insights provide automatic analytics for every chat session. Understand how your agents perform with metrics like goal completion, sentiment, complexity, and quality - all computed automatically without manual analysis.
What It Does
Section titled “What It Does”For each completed session, Pika automatically calculates comprehensive metrics:
- Goal Completion - Likelihood the user's goal was achieved
- Sentiment - User's emotional tone throughout conversation
- Complexity - How difficult the session was to resolve
- Quality Indicators - Response accuracy, completeness, helpfulness
- Performance Metrics - Response time, turn count, tool usage
- Issue Flags - Problems detected during the session
These insights enable data-driven agent improvement without manual session review.
Why It Matters
Section titled “Why It Matters”Without automatic insights:
- You don't know if users accomplished their goals
- User satisfaction is a black box
- Can't identify problematic patterns
- No baseline for measuring improvements
- Hard to prioritize what to fix
Insights transform thousands of chat sessions into actionable intelligence:
- Track success rates across chat apps and agents
- Identify struggling users who need intervention
- Measure improvements after instruction changes
- Compare performance across different agents
- Prioritize work based on data, not guesses
Key Metrics
Section titled “Key Metrics”Goal Completion
Section titled “Goal Completion”What it measures: Whether the user achieved what they came for
How it's computed: AI analyzes the conversation to determine:
- Did the user's questions get answered?
- Were requested actions completed?
- Did the conversation reach natural resolution?
- Did user express satisfaction?
Example insights:
{ "goalCompletion": { "achieved": true, "confidence": 0.85, "evidence": "User confirmed order was found and address updated successfully" }}Why it matters: The ultimate success metric - did we help the user?
Sentiment Analysis
Section titled “Sentiment Analysis”What it measures: User's emotional tone throughout the conversation
How it's computed: Natural language analysis of user messages:
- Positive indicators (thanks, great, perfect, etc.)
- Negative indicators (frustrated, confused, angry, etc.)
- Tone progression over the conversation
- Overall sentiment trajectory
Example insights:
{ "sentiment": { "overall": "positive", "progression": ["neutral", "frustrated", "satisfied"], "finalSentiment": "satisfied" }}Why it matters: Unhappy users = problem sessions needing review
Complexity Score
Section titled “Complexity Score”What it measures: How difficult the session was to resolve
How it's computed: Multiple factors contribute:
- Number of turns required
- Tool invocations needed
- Failures and retries
- Topic switches
- Clarification requests
Example insights:
{ "complexity": { "score": 0.65, // 0-1 scale "factors": { "turns": 8, // More turns = higher complexity "toolCalls": 3, "failures": 1, "topicSwitches": 2 } }}Why it matters: High complexity sessions may need agent improvements
Quality Indicators
Section titled “Quality Indicators”What it measures: Response quality across multiple dimensions
How it's computed: Analysis of agent responses:
- Accuracy (factually correct)
- Completeness (fully answered question)
- Helpfulness (actionable information)
- Appropriateness (tone and content)
- Efficiency (minimal back-and-forth)
Example insights:
{ "quality": { "overall": 0.82, "dimensions": { "accuracy": 0.90, "completeness": 0.85, "helpfulness": 0.80, "efficiency": 0.75 } }}Why it matters: Identifies specific quality dimensions needing improvement
Performance Metrics
Section titled “Performance Metrics”What it measures: Operational performance
Tracked metrics:
- Time to first response
- Average response time per turn
- Total session duration
- Tool execution times
- Number of tool invocations
Example insights:
{ "performance": { "timeToFirstResponse": 2.3, // seconds "avgResponseTime": 3.1, "totalDuration": 185, // seconds "toolInvocations": 3, "avgToolTime": 0.8 }}Why it matters: Performance issues indicate infrastructure or efficiency problems
Issue Detection
Section titled “Issue Detection”What it measures: Problems encountered during session
Detected issues:
- Tool failures
- Verification failures (low grades)
- Incomplete responses
- User frustration signals
- Policy violations
- Error conditions
Example insights:
{ "issues": [ { "type": "toolFailure", "tool": "order-lookup", "turn": 2, "severity": "medium" }, { "type": "userFrustration", "turn": 5, "severity": "low", "evidence": "User said 'that's not what I asked'" } ]}Why it matters: Surface problems that need immediate attention
How It's Produced
Section titled “How It's Produced”Automatic Computation
Section titled “Automatic Computation”Session completes
User ends chat or period of inactivity
EventBridge schedules analysis
Background process queued to run
Insight runner analyzes session
Lambda function computes all metrics:
- Reads full conversation history
- Analyzes user and agent messages
- Reviews tool invocations and results
- Incorporates verification grades
- Considers traces and reasoning
Results stored
Insights written as JSON to:
- DynamoDB (with session data)
- S3 (for long-term storage)
- OpenSearch (for searching and filtering)
Available in Admin Site
Insights immediately queryable and explorable
Scheduled Processing
Section titled “Scheduled Processing”Flexible scheduling options:
- Process immediately after session ends
- Batch process every N minutes
- Run during off-peak hours
- On-demand processing for specific sessions
Configuration
Section titled “Configuration”Enable Insights
Section titled “Enable Insights”const siteConfig = { sessionInsights: { enabled: true, computeImmediately: false, // Batch process instead scheduleExpression: 'rate(15 minutes)' }};Customize Metrics
Section titled “Customize Metrics”Control which insights to compute:
sessionInsights: { enabled: true, metrics: { goalCompletion: true, sentiment: true, complexity: true, quality: true, performance: true, issues: true }}Set Thresholds
Section titled “Set Thresholds”Define what constitutes good/bad:
sessionInsights: { thresholds: { minGoalCompletion: 0.7, // 70% confidence minimum minQuality: 0.75, // 75% quality minimum maxComplexity: 0.6, // Flag if > 60% complexity negativeSentiment: 'concern' // Alert on negative sentiment }}Exploring Insights
Section titled “Exploring Insights”Admin Site Dashboard
Section titled “Admin Site Dashboard”Comprehensive views of your agents' performance:
Overview Dashboard:
- Goal completion rate trend
- Average sentiment over time
- Quality score distribution
- Most common issues
Session List with Filters:
- Filter by goal achieved (yes/no)
- Filter by sentiment (positive/negative/neutral)
- Filter by quality score range
- Filter by complexity level
- Filter by date range
- Filter by chat app or agent
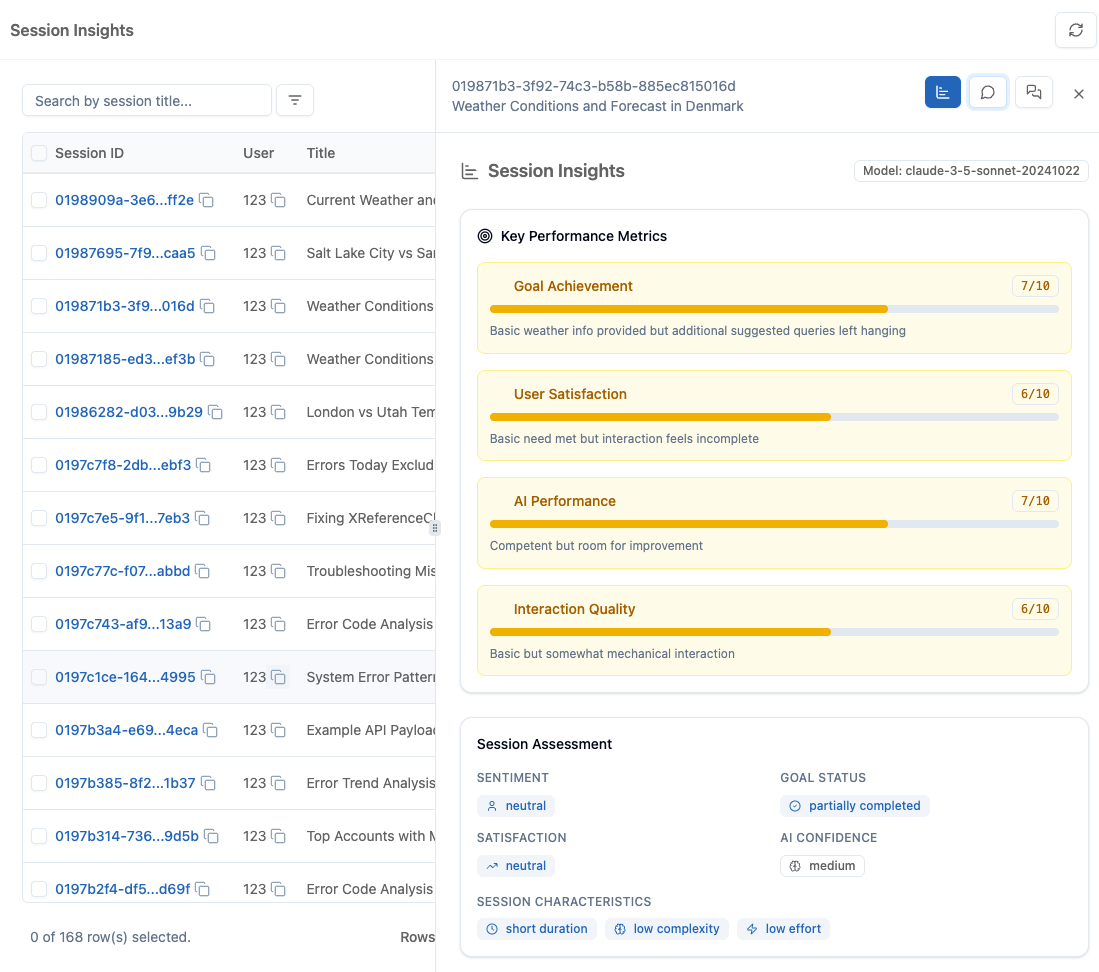
Session Detail View:
- All metrics for specific session
- Full conversation with insights overlay
- Traces with quality indicators
- Feedback (LLM and human)
Aggregated Analytics
Section titled “Aggregated Analytics”See patterns across many sessions:
By Chat App:
Customer Support: 85% goal completion, 3.2 avg complexitySales Assistant: 92% goal completion, 2.1 avg complexityTech Support: 78% goal completion, 4.5 avg complexityBy Time Period:
Week 1: 82% goal completion, 0.78 quality scoreWeek 2: 88% goal completion, 0.84 quality score ← Improving!Week 3: 91% goal completion, 0.87 quality scoreBy Agent:
general-agent: 85% goal completionspecialist-agent: 94% goal completion ← Better for complex queriesfallback-agent: 72% goal completionUse Cases
Section titled “Use Cases”Performance Monitoring
Section titled “Performance Monitoring”Track agent effectiveness:
- Daily/weekly goal completion rates
- Quality score trends
- Performance regression detection
- Comparison across agents
Iterative Improvement
Section titled “Iterative Improvement”Data-driven refinement:
- Measure baseline metrics
- Make instruction changes
- Compare new metrics to baseline
- Iterate based on results
Problem Identification
Section titled “Problem Identification”Find issues quickly:
- Sessions with goal completion < 70%
- Negative sentiment sessions
- High complexity sessions
- Sessions with multiple issues
User Experience Optimization
Section titled “User Experience Optimization”Improve satisfaction:
- Identify frustration patterns
- Reduce complexity in common scenarios
- Optimize slow responses
- Fix recurring failures
Capacity Planning
Section titled “Capacity Planning”Understand load and performance:
- Peak usage times
- Average session duration
- Tool usage patterns
- Infrastructure bottlenecks
Advanced Features
Section titled “Advanced Features”Custom Metrics
Section titled “Custom Metrics”Define domain-specific measurements:
customInsights: [ { name: 'policyCompliance', compute: (session) => { // Your custom logic return complianceScore; } }, { name: 'escalationRate', compute: (session) => { // Detect human escalations return wasEscalated; } }]Alerts and Notifications
Section titled “Alerts and Notifications”Get notified of concerning patterns:
- Goal completion drops below threshold
- Spike in negative sentiment
- Unusual number of failures
- Performance degradation
Comparative Analysis
Section titled “Comparative Analysis”Compare across dimensions:
- Agent A vs Agent B
- This week vs last week
- Internal users vs external users
- Chat app X vs chat app Y
Export and Integration
Section titled “Export and Integration”Use insights elsewhere:
- Export to CSV/JSON
- Feed into BI tools (Tableau, Looker)
- Integrate with monitoring (Datadog, New Relic)
- Generate executive reports
Best Practices
Section titled “Best Practices”Set Realistic Baselines
Section titled “Set Realistic Baselines”Understand normal performance:
- Not every session will complete goal
- Some complexity is normal
- Initial quality may be lower
- Track trends, not absolute perfection
Review Regularly
Section titled “Review Regularly”Make insights review a habit:
- Weekly review of key metrics
- Monthly deep dive into patterns
- Quarterly goal-setting based on data
- Continuous improvement mindset
Act on Data
Section titled “Act on Data”Insights are only valuable if you use them:
- Prioritize fixes for common issues
- Celebrate improvements
- Share wins with team
- Document what worked
Combine Multiple Signals
Section titled “Combine Multiple Signals”Holistic view of quality:
- Insights + LLM Feedback + Human Feedback
- Quantitative metrics + Qualitative reviews
- Short-term spikes + Long-term trends
- Technical metrics + Business outcomes
Performance and Cost
Section titled “Performance and Cost”Computation Time
Section titled “Computation Time”Insights generate quickly:
- Average: 1-2 seconds per session
- Asynchronous (no user impact)
- Batch processing optimized
- Scales automatically
Storage Requirements
Section titled “Storage Requirements”Minimal storage overhead:
- Average 2-3KB per session
- Compressed JSON in DynamoDB
- Indexed in OpenSearch
- S3 for long-term archive
Cost Considerations
Section titled “Cost Considerations”Insights use minimal resources:
- Simple computation (not LLM-based)
- Efficient batch processing
- Pay only for compute used
- Typical cost: <$0.001 per session
Getting Started
Section titled “Getting Started”Enable Insights
Configure insights generation for your deployment.
View in Admin Site
Explore session insights in the admin interface.
Understanding Insights
Deep dive into insight computation architecture.
Related Capabilities
Section titled “Related Capabilities”LLM-Generated Feedback
Qualitative analysis complements quantitative insights.
Self-Correcting Responses
Real-time quality control generates data for insights.
Admin Site
Dashboard for exploring all insights.